Tasks posed in the challenge
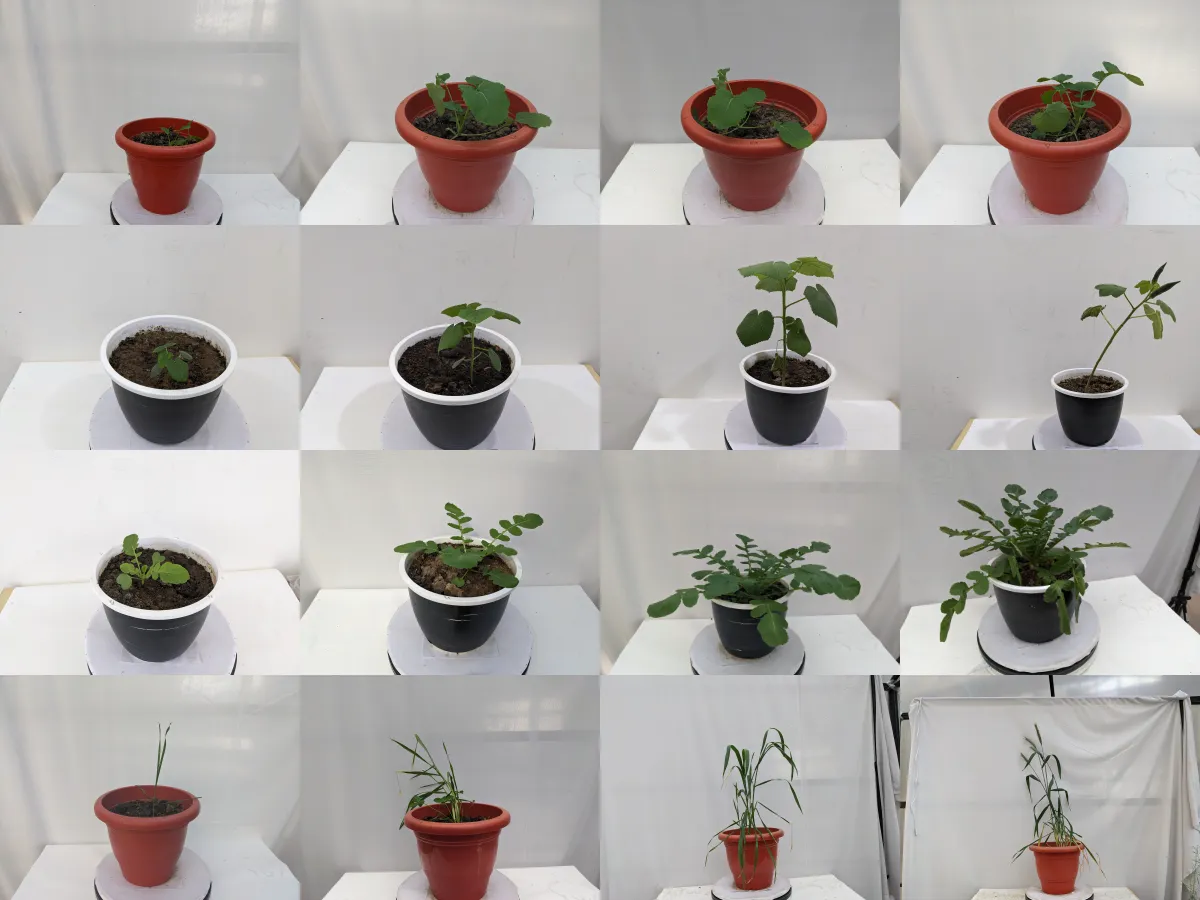
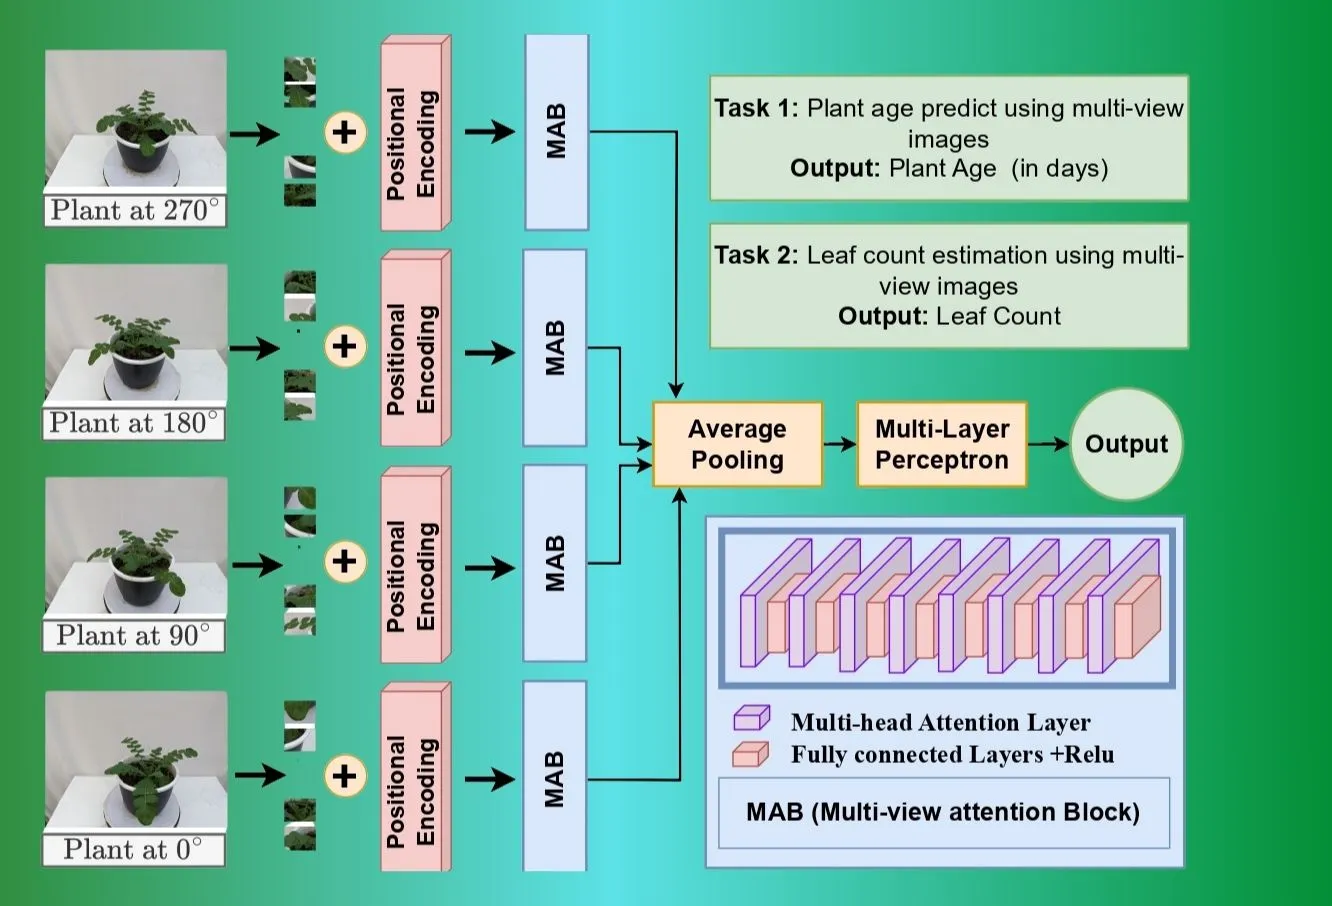
Plant Age Prediction using Multi-view Images
Participants must develop a model that predicts the age of a plant in days using multiple views of the same plant. The dataset for each crop should be used separately for training and validation. The dataset consists of images captured at five different height levels, and participants must incorporate all five levels in their model. The participants can vary the number of images per level to cover a 360° view. The accuracy of predictions will be assessed using MAE, with results reported separately for each crop. The final evaluation for this task will be based on the average MAE across all crops.
Read More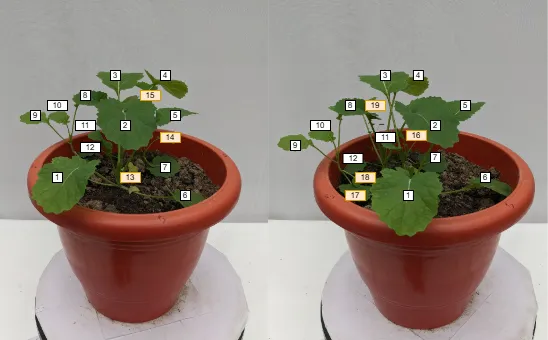
Leaf Count Estimation using Multi-view Images
Participants must build a model that counts the number of leaves on a plant using multiple views of the same plant. The dataset for each crop should be used separately for training and validation. The dataset consists of images captured at five different height levels, and participants must incorporate all five levels in their model. The participants can vary the number of images per level to cover a 360° view. The leaf count estimation will be assessed using MAE, with results reported separately for each crop. The final evaluation for this task will be based on the average MAE across all crops.
Read More